
for the chapter on data analysis and visualization
Get Started for FREE
Sign up with Facebook Sign up with X
I don't have a Facebook or a X account


 Your new post is loading...
 Your new post is loading...
Your new post is loading...
for the chapter on data analysis and visualization 
No comment yet.
Sign up to comment
|

Beth Kanter's comment,
August 4, 2011 12:44 PM
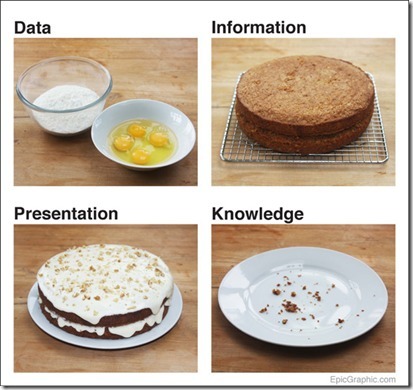
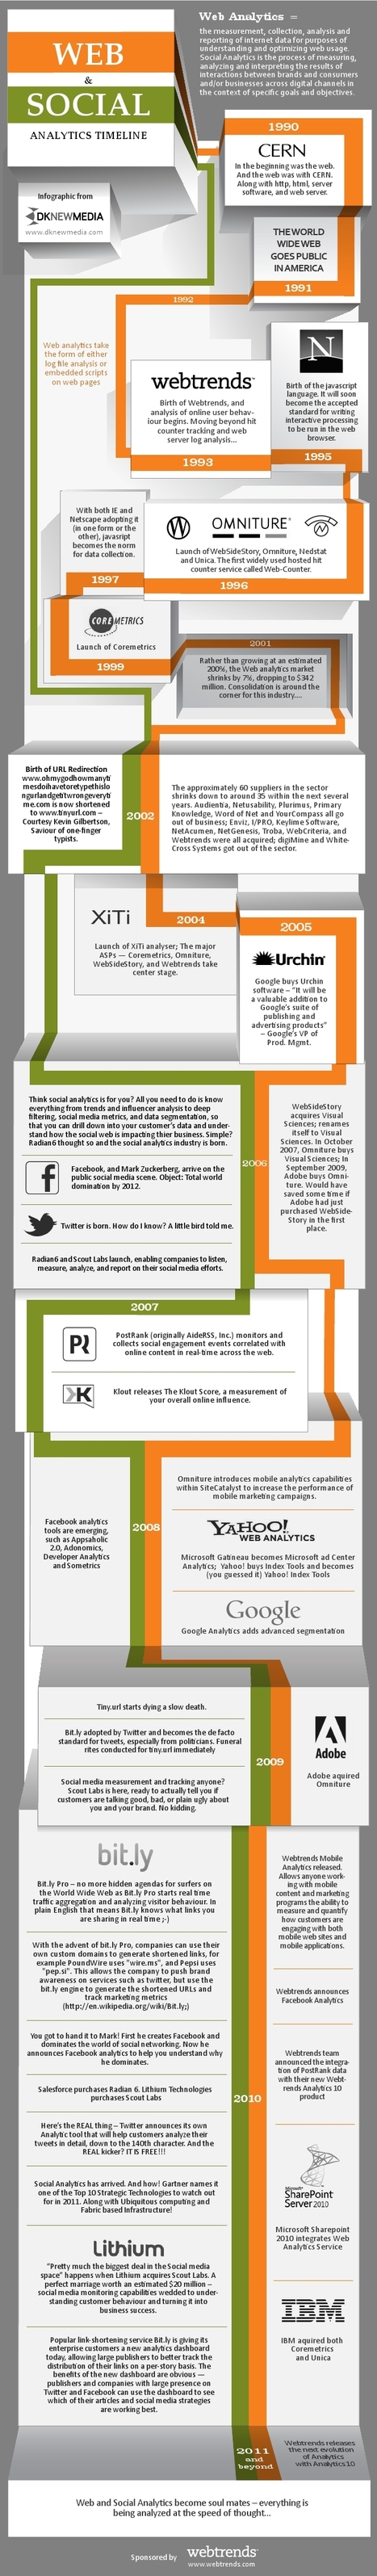
Useful diagram to explain the process, help map out a ladder of engagement and metrics to track. Also can be useful to figure out how and where A/B testing fits in.
|

![7 Secrets of Social Media Conversion [Infographic] – Full Size View | Unbounce | Measuring the Networked Nonprofit | Scoop.it](https://img.scoop.it/g-JpyS8w0Hf2UGNcBd89ozl72eJkfbmt4t8yenImKBVvK0kTmF0xjctABnaLJIm9)