Curated by Beth Kanter
http://www.bethkanter.org
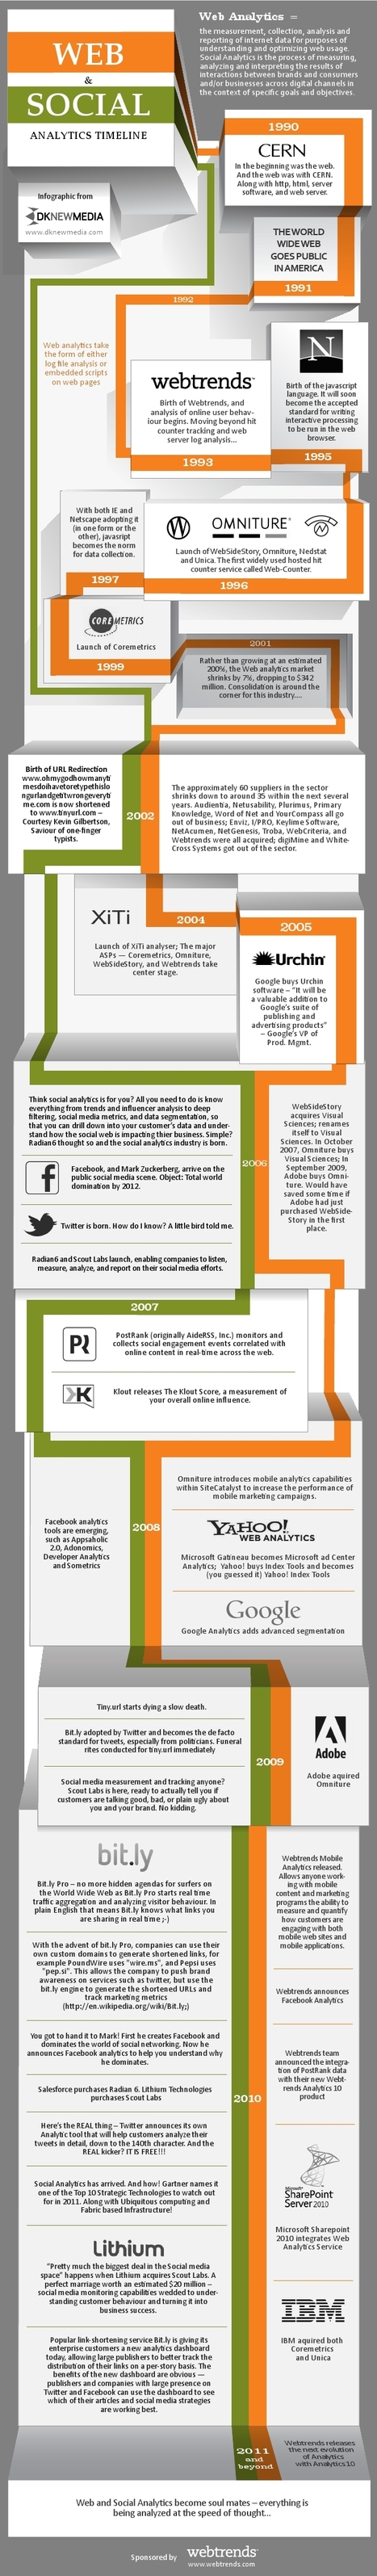
Influences means a couple of different things. You can measure other people's influence - as part of identifying champions or super fans or you can measure your own influence or organization's as part of a goal to have "thought leadership."
This is a vanity metric - and there are several tools you can use to measure it. This Infographic shows some of them.
Most important bit is the how to:
If you are really interested in taking advantage of your social influence score, it’s not enough checking your level every now and then. You’ll have to act.
What follows are the steps to develop a successful action plan according to Brian Solis (new media analyst at The Altimer Group) :
Track performances against current benchmarks that capture existing sentiments, behaviours and awareness.
Define who is your target audience.
Develop the strategy. You’ll find here the difference with the classic social media campaigns: you’ll have to take into account both your community and all your community’s followers. Find out what does matter to them and use that info in your daily content.
Determine who are your most influential followers and use them in order to improve your social media campaign. If they are engaged, they will help you with no doubt. This is the time to use the digital social influence tools.
Launch the campaign: do not forget these kind of activities take place in real time. Key influencers’ behaviours are totally unexpected. That is the reason the next step is crucial.
Measure constantly. Monitor everything every day of the campaign and modify the strategy when needed.


 Your new post is loading...

![Is Your Business Monitoring What Matters On Social Media? [INFOGRAPHIC] | Measuring the Networked Nonprofit | Scoop.it](https://img.scoop.it/D2QX9Dfpc0M-CiaG2IVC9Tl72eJkfbmt4t8yenImKBVvK0kTmF0xjctABnaLJIm9)


![7 Secrets of Social Media Conversion [Infographic] – Full Size View | Unbounce | Measuring the Networked Nonprofit | Scoop.it](https://img.scoop.it/g-JpyS8w0Hf2UGNcBd89ozl72eJkfbmt4t8yenImKBVvK0kTmF0xjctABnaLJIm9)

![Big Data Reaches Cosmic Proportions [Infographic] | Measuring the Networked Nonprofit | Scoop.it](https://img.scoop.it/_mmUwdWr2rJFwLCgaRlm3Tl72eJkfbmt4t8yenImKBVvK0kTmF0xjctABnaLJIm9)
![What is EdgeRank? [Illustration] | Measuring the Networked Nonprofit | Scoop.it](https://img.scoop.it/HHSloqhDWRriLwT-7e697jl72eJkfbmt4t8yenImKBVvK0kTmF0xjctABnaLJIm9)


This article looks at how we have almost become lazy with our sampling methods. For example when we look up keyword searches like a brand name, it is more effective to look at the whole conversation. Another common metric we use is using sample sets of data, although there is so much data it would be impossible to look at every single piece of data, it is important to set a sample size big enough so that the data has minimal outliers. For example a sample size of 10 might give you a totally different picture than a sample size of 100.
What is not talked about in this article that was touched on in class was the idea of getting the whole picture. For example with software they may be using keywords like they say in the article but it may not have the typical connotation when read in context of the statement.